Census 1940 Reveals a Smaller but Better California
Published on April 11th, 2012
As soon as I read on the CAPS homepage that the National Archives and Record Administration had released detailed 1940 census information, I joined millions of other American trying to access the online data. The interest in the 1940 census that included 3.8 million handwritten pages was so keen that hours passed before I could get on the site.
Like many others, I was motivated by my status as unofficial Guzzardi family historian. During the 1930s, my Sicilian-born father moved to California from New York where he met my mother who grew up in Merced. My maternal grandmother came to California from a small Iowa farm. In the 1930s California, especially Southern California and the San Joaquin Valley, were prime destinations for Midwesterners.
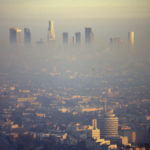
While I wasn’t yet born in 1940, I grew up in the unspoiled era just after the decade’s turn and have photo albums that show a California few could believe existed if they hadn’t been there to experience it. To name two examples, I recall driving through the San Fernando Valley on the way to my grandfather’s ranch and seeing little other than orange groves en route. And I also remember family picnics on nearly deserted Santa Monica beaches. Today, strip malls have replaced the orange groves and there’s no available beach parking. The old snapshots are painful to look at.
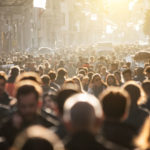
Among the other changes chronicled by the 1940 census, all negative and all caused by over- immigration which in turn led to overpopulation, are:
- Only six California cities in 1940 had populations of 100,000 or more: Long Beach, Los Angeles, Oakland, Sacramento, San Diego and San Francisco. In 2010, 67 cities had populations greater than 100,000. In 1940, California was the nation's fifth-largest state, trailing New York, Pennsylvania, Illinois and Ohio.
- Nearly 87 percent of Californians were American-born in 1940. In 2010, 71.6 percent were born in the United States, including 53.8 percent in California.
- The 1940 Census recorded Californians in three primary categories for race: white (95.5 percent), Negro, the word used at the time, (1.8 percent) and other races including Hispanic and Asian (2.7 percent).
In 2010, the census asked more detailed questions about race and origin. Nearly 58 percent of Californians identified themselves as white, 6.2 percent as black or African American, 1 percent as American Indian and Alaska native, 13 percent as Asian, 0.4 percent as native Hawaiian and other Pacific islander, 17 percent as other, and 4.9 percent as two or more races. Among all races, 37.6 percent identified as Hispanic or Latino. An interactive census 2010 map is here.
In that simpler and less populated era seven decades ago, Californians were better educated.
While just 24.5 percent of Americans had earned at least a high school diploma in 1940, more than 37 percent of Californians had secondary degrees, the nation’s highest rate. California also had the highest rate of college graduates among states, 6.8 percent, behind only Washington, D.C.'s 11.1 percent.
In 2010, 80.7 percent of Californians were high school graduates and 30.1 percent held at least a bachelor's degree. While higher than in 1940, those rates are no longer the United States’ best: 85.6 percent of Americans now have at least high school diplomas and 28.2 percent are college graduates. Read my CAPS Issues analysis of California’s education crisis here.
The smaller California of my youth was a better place to live. The state’s unchecked population growth spawned almost exclusively by immigration and immigrants’ children has diminished its quality of life to a level no one could have imagined in 1940.