Report: Largest Number Ever of Immigrants Living in U.S. – 42.4 Million Legal and Illegal
Published on October 10th, 2016
By Penny Starr
October 10, 2016
CNSNews.com
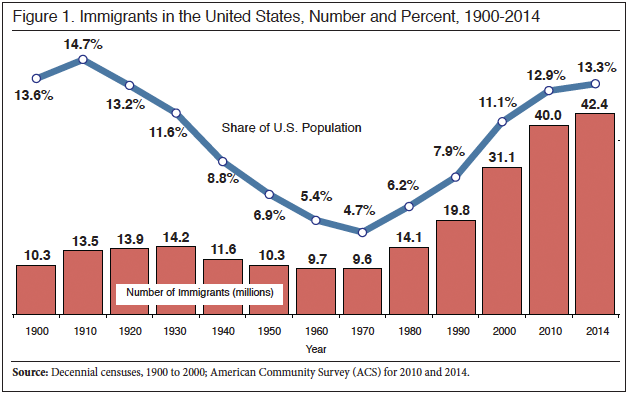
A new report released earlier this month by the Center for Immigration Studies reveals that the number of legal and illegal immigrants living in the United States in 2014 is the highest number seen in U.S. history, with 42.4 million living in this country.
Using data from the U.S. Census Bureau, the report also shows that the nation’s population includes 13.3 percent who are immigrants – the highest percentage in 94 years.
Some of the other findings of the report include:
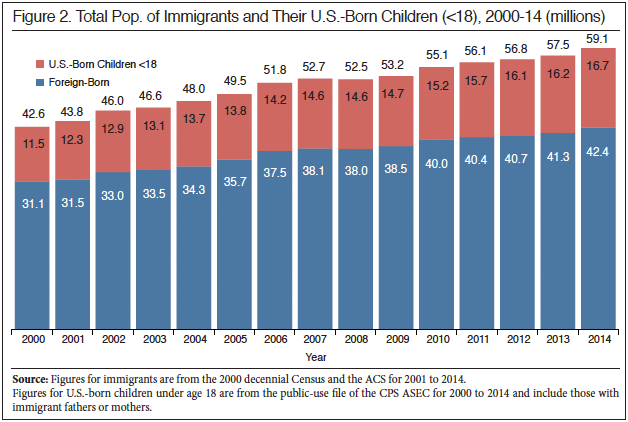
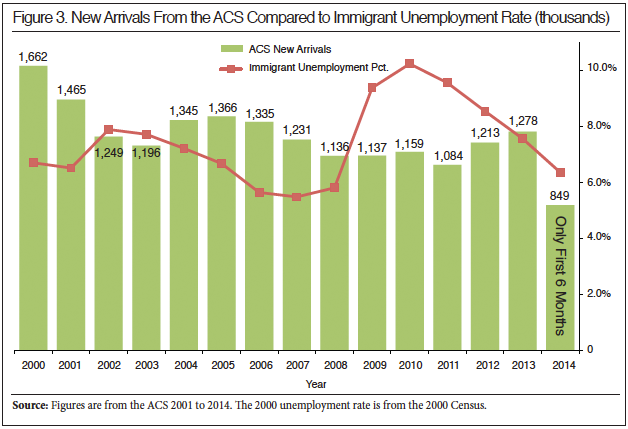
• Between 2000 and 2014, 18.7 million new immigrants (legal and illegal) settled in the United States. Despite the Great Recession beginning at the end of 2007, and the weak recovery that followed, 7.9 million new immigrants settled in the United States from the beginning of 2008 to mid-2014.
• From 2010 to 2014, new immigration (legal and illegal) plus births to immigrants added 8.3 million residents to the country, equal to 87 percent of total U.S. population growth.
• The sending countries with the largest percentage increases in immigrants living in the United States from 2010 to 2014 were Saudi Arabia (up 93 percent), Bangladesh (up 37 percent), Iraq (up 36 percent), Egypt (up 25 percent), and Pakistan, India, and Ethiopia (each up 24 percent).
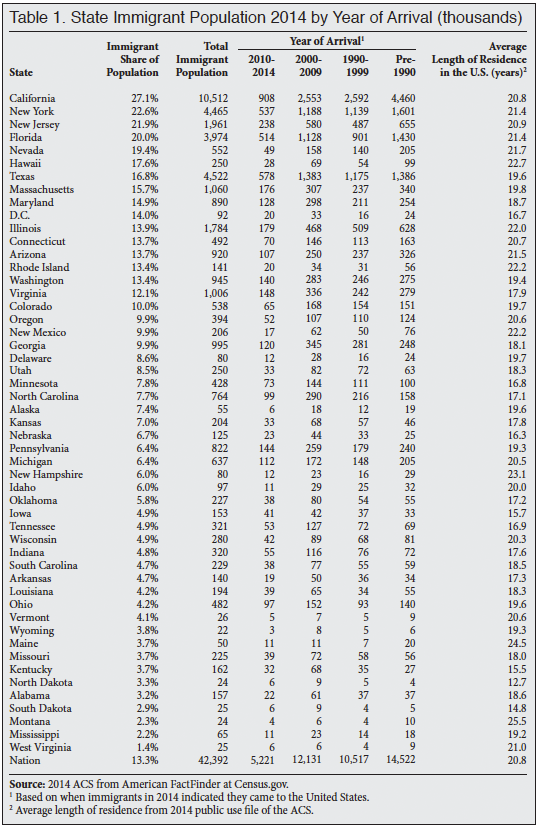
• States with the largest percentage increases in the number of immigrants from 2010 to 2014 were North Dakota (up 45 percent), Wyoming (up 42 percent), Montana (up 19 percent), Kentucky (up 15 percent), New Hampshire (up 14 percent), and Minnesota and West Virginia (both up 13 percent).
The report also looked at labor and employment among immigrants as compared to natives, with a large share of immigrants having low levels of education – 28 percent of adult immigrants (ages 25 to 65) have not completed high school compared to eight percent of natives.
Included in the statistics for 2014 is that 42 percent of immigrant-headed households used at least one welfare program (primarily food stamps and Medicaid) compared to 27 percent of natives.
The report also revealed that 10.9 million students from immigrant households are enrolled in U.S. public schools and account for nearly 23 percent of all public school students.